
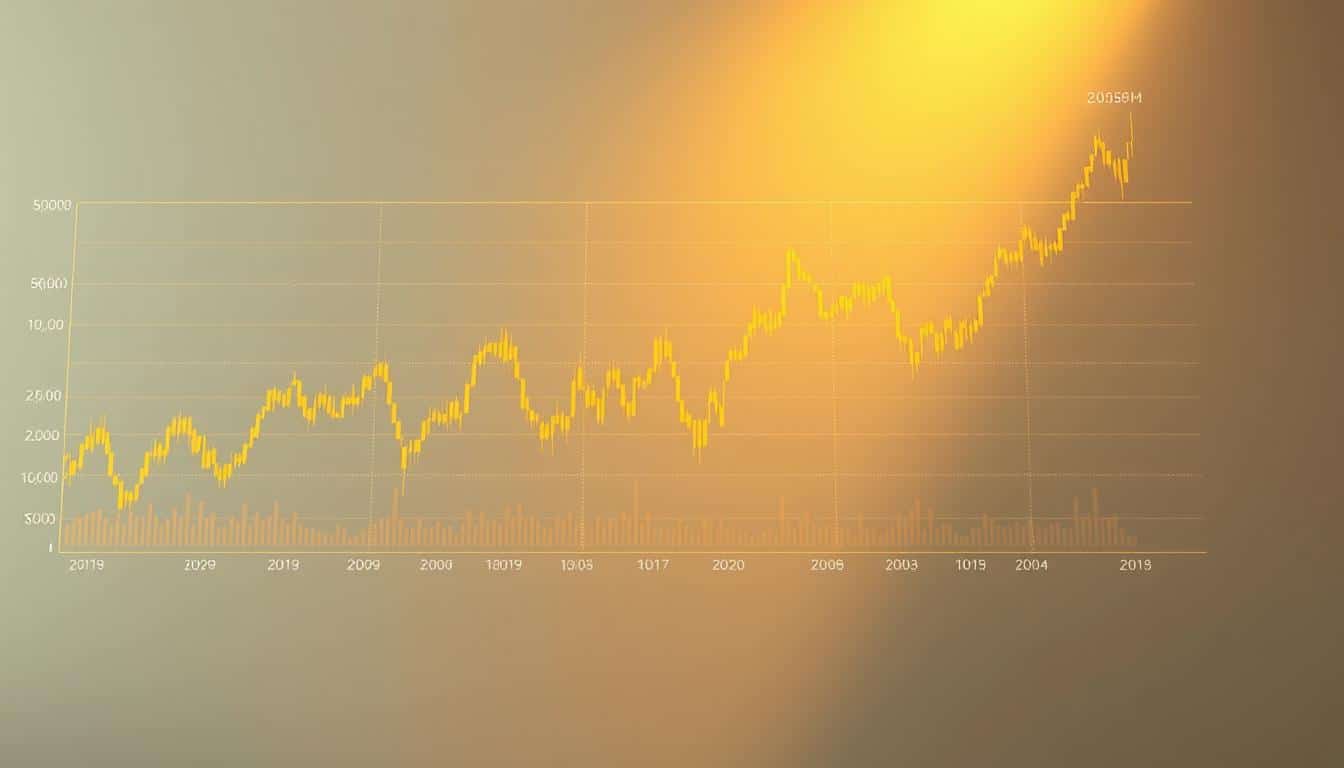

A gold price chart is more than a squiggly line. It is a running record of how investors respond to economic uncertainty, currency moves, and shifts in central bank policy. Learning to read one is a practical skill whether you already hold gold or are weighing a first purchase.
Where Gold Prices Stand in 2026
Gold has traded lower through 2026. According to Trading Economics, gold fell to $4,116.43 per troy ounce on October 22, 2026 — down 0.60% from the previous day — and the price has fallen 3.99% over the past month.
Macrotrends shows a similar picture on a longer horizon: gold stood at $4,132 per ounce as of October 21, 2026, down 5.2% from $4,359 a year earlier and down 4.4% so far in 2026.
Numbers like these mean little in isolation. On a daily chart, a pullback can look alarming; on a yearly chart, the same move may read as a routine pause. That gap between the short view and the long view is exactly what chart literacy helps you close.
Understanding Gold Price Trends
Gold price trends tend to repeat because the fears behind them repeat. The 2008 financial crisis triggered a flight to safety as the banking system buckled. The 2011 European debt crisis revived sovereign-default fears across Europe. Then the freezing of Russian assets in 2022 marked a structural turning point: central banks, particularly in emerging markets, began rethinking the political risk carried by dollar reserves and stepped up gold purchases.
That distinction matters when you study a chart. Temporary crises create temporary spikes. Structural changes in how reserve assets are viewed create sustained pressure, because central banks keep buying regardless of short-term sentiment. De-dollarization — countries reducing dependence on dollar-denominated trade and reserves — has moved from talking point to active policy in a number of nations.
Traditional drivers still matter alongside these structural forces: Federal Reserve interest-rate decisions, real (inflation-adjusted) interest rates, the strength of the U.S. dollar, and geopolitical tensions. A weaker dollar makes gold cheaper for foreign buyers, which is why the metal and the currency so often move in opposite directions.
How to Read a Gold Price Chart
Every gold chart shares the same basic anatomy:
- Axes. The vertical axis shows price in dollars per troy ounce; the horizontal axis shows time, from hours to decades.
- Price lines or candlesticks. Upward movement means buyers are in control; downward movement means sellers are.
- Volume bars. These show how much gold changed hands. Price moves on heavy volume carry more conviction than moves on thin trading.
- Moving averages. Smooth lines that reveal the underlying trend. The 50-day and 200-day averages are the most widely watched, and a shorter average crossing above a longer one is generally read as positive.
- Support and resistance. Price levels where gold has repeatedly bounced or stalled. Because so many traders watch them, they often become self-fulfilling.
Choosing a chart type
| Chart type | What it shows | Best used for |
|---|---|---|
| Line chart | Closing prices only | Long-term trend identification |
| Candlestick chart | Open, high, low, and close, plus market sentiment | Detailed analysis and pattern recognition |
| Bar chart | Open, high, low, and close | Technical precision |
Tips for interpreting price data
- Zoom out first. Check the monthly and yearly trend before reacting to a daily move.
- Look for confirmation. A series of higher highs and higher lows suggests an uptrend; the reverse pattern suggests a downtrend. Single-day moves prove little.
- Pair price with volume. Rising prices on rising volume are more reliable than rallies on thin trading.
- Use several timeframes. Establish the long-term direction first, then zoom in for timing.
- Stay humble. Charts describe what has already happened. They help you weigh probabilities; they do not predict the future.
Gold Price Predictions for 2026
Some major-bank research points sharply higher from here. J.P. Morgan Global Research analysts expect gold to push $6,000 per ounce by year end and see $6,300 per ounce as a possibility for 2027.
Treat any forecast as a probability-weighted scenario rather than a promise. Reputable institutions tend to get direction right more often than exact prices, and unexpected geopolitical or economic shifts can derail even well-reasoned projections. The indicators worth watching are the ones analysts themselves watch: Federal Reserve rate decisions, real interest rates, the U.S. dollar’s trajectory, central bank purchase data, and geopolitical developments.
Tools for Tracking Gold Prices
You no longer need an institutional terminal to follow the market closely:
- Kitco offers spot prices, futures data, extensive historical charts, and market commentary.
- GoldPrice.org keeps things simple, with customizable charts across a wide range of timeframes and currencies.
- BullionVault combines live price charts with the ability to buy and sell vaulted gold.
- TradingView is a strong option for technical analysis, with indicators, trendline tools, custom alerts, and side-by-side asset comparisons.
- Investing.com places gold alongside broader market data, which helps when you want to track correlations.
- The World Gold Council publishes quarterly demand reports covering central bank purchases, jewelry demand, and investment flows — fundamental context behind the price action.
Whichever tools you choose, set price alerts at levels that matter to your plan instead of checking quotes compulsively. A short weekly review of the major timeframes usually serves long-term investors better than daily price-watching.
Buying Physical Gold Online
Choosing a reputable dealer is the first critical step. Established names include APMEX, JM Bullion, SD Bullion, and Kitco. Before a first purchase, check the dealer’s Better Business Bureau rating, confirm membership in recognized industry organizations, and read recent customer reviews on independent platforms rather than only the dealer’s own site. Transparent dealers display the spot price, the premium, and the total price clearly; treat high-pressure sales tactics or prices far below competitors as warning signs.
Expect to pay a premium over the spot price for physical products, with larger bars and coins generally carrying lower premiums per ounce than small fractional pieces. Use insured, tracked shipping with signature confirmation, inspect every order against the invoice as soon as it arrives, and arrange secure storage — a safe deposit box, a quality home safe, or allocated vault storage — before the metal is delivered.
One detail that trips up new buyers: gold is measured in troy ounces (31.1 grams), not regular ounces (28.35 grams). The difference matters whenever you compare prices by weight.
Frequently Asked Questions
What influences gold prices the most?
Uncertainty, in all its forms. Federal Reserve policy, real interest rates, dollar strength, geopolitical tensions, and de-dollarization each feed demand for a neutral asset that no government can print. Since the freezing of Russian assets in 2022, central bank buying has added a source of demand that does not depend on investor sentiment.
How accurate are gold price forecasts?
Mixed at best. Institutional forecasts are grounded in observable factors and tend to capture direction better than precise levels, but surprise events can overturn them quickly. Use forecasts to understand the reasoning and the risks, not as guarantees.
Should I own physical gold or a gold ETF?
They serve different purposes. Physical gold carries no counterparty risk and is recognized everywhere, but it must be stored and takes longer to sell. ETFs trade as easily as stocks, though you own shares in a fund rather than metal in hand. Many investors hold both.
Reading the Chart, Not the Noise
A gold price chart rewards patience. Zoom out before you react, confirm trends with volume, and connect what you see on screen to the forces that actually move the metal — central bank demand, currency shifts, interest rates, and geopolitics. Check today’s quote against the longer trend, follow a handful of reliable trackers, and treat forecasts as context rather than certainty. That approach turns a stream of flickering numbers into information you can actually use.